As a Power BI user, you might be wondering how Microsoft Fabric affects your existing reports and your organization’s data processes. The good news is, that not much has changed in terms of how you use Power BI since it is an integral part of Microsoft Fabric.
Microsoft Fabric is a comprehensive solution for storing, managing, and analyzing data. While Power BI focuses on data visualization and reporting, Microsoft Fabric provides a broader platform for data integration and management. Despite being part of the larger Microsoft Fabric ecosystem, Power BI maintains its independent operation, allowing users to continue leveraging its powerful visualization capabilities without disruption.
New Features in Power BI
With the introduction of Microsoft Fabric, several new features have been added to enhance Power BI’s capabilities. These include:
- Git integration
- Direct Lake mode
- Ability to edit data models on the web
Learn More – Aspects that make Power BI Advantageous for all your Manufacturing Operations
a) Git Integration
Git integration in Power BI allows developers to incorporate their development processes, tools, and best practices directly into the platform. This integration provides several advantages:
- Developers can back up their work and maintain version control, making it easy to revert to previous stages if needed.
- Git branches enable collaboration among team members or allow developers to work independently.
- Developers can use familiar source control tools to manage items effectively.
b) Direct Lake Mode
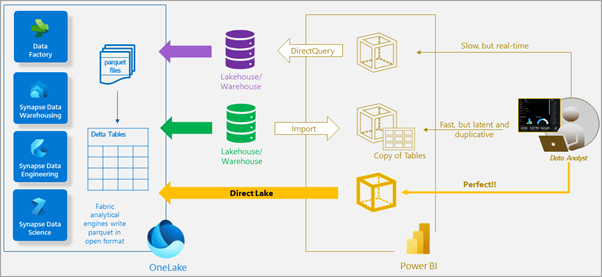
Direct Lake mode offers a fast path to load data from the lake directly into the Power BI engine for analysis. This feature allows for the loading of Parquet-formatted files from a data lake without querying a Lakehouse endpoint or importing data into a Power BI dataset.
Key benefits of Direct Lake mode include:
- Security: It supports row-level and object-level security, ensuring users only see authorized data.
- Automatic Updates: Data changes in OneLake are automatically reflected in Direct Lake models, though manual refresh can be enabled for more flexible data management.
-
-
- Prerequisites for Direct Lake: Direct Lake is supported on Power BI Premium P and Microsoft Fabric F SKUs only. It is not available on Power BI Pro, Premium Per User, or Power BI Embedded A/EM SKUs.
-
c) Editing Data Model on the Web
The ability to edit data models on the web is another significant enhancement. Users can now add or modify relationships online and create or edit measures and calculated columns directly in the web interface.
1. Microsoft Fabric vs Power BI: Architecture
a) Microsoft Fabric Architecture Overview
Microsoft Fabric is built on the foundation of OneLake, a unified storage layer designed to fetch data from various cloud warehouses and lakes, including Microsoft platforms. This lakehouse architecture leverages the open-source delta lake format, moving away from traditional relational storage models. The flexibility and scalability of this approach enable a more efficient data management system.
Seven primary workloads operate on OneLake within Microsoft Fabric:
-
- Data Factory: A robust data integration service.
- Synapse Analytics Services: Providing comprehensive solutions for Data Warehousing, Data Engineering, Data Science, and Real-Time Analytics.
- Power BI: The well-known business intelligence service for data visualization and reporting.
- Data Activator: A real-time monitoring service ensuring timely responses to data changes.
b) Power BI Architecture Overview
Power BI architecture comprises several critical components:
- Power Query: A powerful data connection technology that allows for extensive data transformation.
- Power Pivot: An in-memory data modeling component that supports complex data analysis.
- Data Analysis Expressions (DAX): A formula language used to create custom calculations within Power BI.
- Power BI Report Server: A server-based platform that facilitates the publishing of Power BI reports within an organization’s firewall.
- Power BI Gateway: Acts as a bridge between Power BI’s cloud service and on-premises data sources, ensuring seamless data connectivity.
- Power BI Visuals: A set of graphical elements, such as charts and graphs, that represent data in a user-friendly manner.
Power BI supports both desktop and mobile users with applications tailored to different operating systems, enhancing accessibility and usability.
2. Microsoft Fabric vs Power BI: Capabilities
Microsoft Fabric encompasses a broader range of data integration and processing capabilities, while Power BI zeroes in on the end-use of data through visualization and reporting.
a) Microsoft Fabric Capabilities
Microsoft Fabric is designed to manage and streamline the entire data lifecycle, from ingestion to analysis. Here are some of its key capabilities:
- Automate the process of moving and transforming data.
- Storage and analysis of large data volumes is centralized in a scalable environment.
- Users can build, train, and deploy machine learning models directly within the platform, facilitating advanced analytics and predictive capabilities.
- Fabric supports real-time data processing and analysis, enabling timely insights and decision-making.
- A dedicated space called a tenant is used to manage all resources. This tenant acts as a secure, isolated environment that houses all data, users, services, and resources for an organization.
- Fabric integrates AI services into workflows, and future enhancements will include conversational language support to simplify interaction for business users.
Learn More – Accelerate Insights: Real-Time Analytics and Business Intelligence with Microsoft Fabric
b) Power BI Capabilities
Power BI is renowned for its powerful data visualization and reporting features. Here are the core capabilities of Power BI:
- Power BI allows users to connect to various data sources, perform data transformation, and prepare data for analysis using Power Query.
- Users can create visually appealing and interactive reports using a wide range of visualization options.
- Reports can be published to the Power BI Service, cloud-based platform that enables sharing and collaboration with stakeholders.
- Creation of interactive dashboards that offer consolidated views of key metrics. Users can explore and analyze data through various interactive elements, such as filters and slicers.
- Power BI supports mobile users with dedicated applications, ensuring data accessibility on the go.
3. Microsoft Fabric vs Power BI: Security & Governance
Both Power BI and Microsoft Fabric offer robust security features, but their approaches and specific capabilities can differ.
a) Power BI Security & Governance
Power BI employs several security and governance features to ensure data protection and controlled access:
-
- Role-Based Access Control (RBAC)
- Row-Level Security (RLS)
- Data Classification and Sensitivity Labels
- Auditing and Monitoring
- Scheduled Data Refresh
- Collaboration and Sharing
b) Microsoft Fabric Security & Governance
Microsoft Fabric also incorporates a comprehensive set of security and governance features, tailored to its broader data integration and management capabilities:
-
- Conditional Access: This feature allows administrators to control access to resources based on user identity and location.
- Regional Resiliency: Microsoft Fabric ensures data reliability through replication across Azure availability zones, providing robust protection against data loss and ensuring high availability.
- Lockbox: Lockbox provides explicit approval control over Microsoft engineers’ access to your data, giving organizations more control over who can access their data and under what circumstances.
Power BI excels in providing granular access control and security features tailored for data visualization and reporting. In contrast, Microsoft Fabric offers broader security and governance capabilities designed for comprehensive data management, integration, and processing across multiple platforms and services.
4. Microsoft Fabric vs Power BI: Use Cases
Microsoft Fabric is ideal for managing large volumes of structured data, simplifying data integration, supporting end-to-end data science workflows, enabling real-time analysis, and facilitating accurate predictions for future trends. It excels in backend data management and preparation.
Learn More – Utilizing the Power of Big Data Analytics for Oil and Gas Industry
Power BI is designed for data analysis and visualization. It supports creating interactive reports and dashboards, performing real-time analytics, and integrating with machine learning tools for predictive analysis. Power BI focuses on the front-end analysis and visualization of data to derive actionable insights.
Integrating Microsoft Fabric with Power BI: Here’s What You Need to Know
Integrating Microsoft Fabric with Power BI allows you to harness the full potential of both platforms for comprehensive data management, analysis, and visualization. Here is a step-by-step guide to help you get started:
Prerequisites
- Sign Up for Microsoft Fabric: Begin by signing up for a free trial of Microsoft Fabric.
- Create a New Workspace: Establish a new workspace and assign it Fabric capacity.
- Download Power Query Template: Obtain the Power Query template file containing sample Contoso data.
Step-by-Step Integration Guide
- Create a Lakehouse:
- In your Fabric workspace, navigate to “New” and select “Lakehouse” under the Data Engineering category.
- Name your Lakehouse (e.g., “SalesLakehouse”) and create it.
- Prepare and Load Data into the Lakehouse:
- Access the Lakehouse editor and utilize Dataflows Gen2.
- Open the Power Query Online editor and import the Contoso template file.
- Select specific queries (e.g., “DimDate”) and configure the necessary connections.
- Perform required data transformations and repeat the process for other queries like “DimCustomer,” “DimEmployee,” etc.
- Add a Data Destination:
- For each table (e.g., “DimDate”), click “Add data destination” from the Home tab.
- Choose “Lakehouse” as the destination, set the authentication, select SalesLakehouse, and specify the update method (e.g., “Replace” or “Append”).
- Save the settings for each table.
- Orchestrate a Data Pipeline:
- Create a new pipeline within the Lakehouse editor.
- Add a pipeline activity and select “Dataflow” as the type.
- Configure the activity by specifying the OnlineSalesDataflow.
- Add additional activities as needed, such as an Office365 Outlook activity for email notifications.
- Configure settings (recipients, email subjects), save the pipeline, and schedule it to run at a specific time or interval.
- Create a Semantic Model:
- Access the SQL Endpoint of the SalesLakehouse in your workspace.
- In Explorer, select the SQL Endpoint item and switch to the Model view.
- Establish relationships between tables by dragging and dropping columns (e.g., connect the CustomerKey column from FactOnlineSales to the CustomerKey column in DimCustomer).
- Repeat the process for other tables like DimProduct, DimStore, and DimDate.
Concluding Thoughts
Microsoft Fabric and Power BI each excel in different areas. Used together, they provide a powerful, end-to-end data solution, enabling efficient data handling and insightful visualizations for better decision-making.
By integrating Microsoft Fabric with Power BI, organizations can leverage the full potential of both platforms, ensuring that data is not only managed and processed efficiently but also presented in a way that facilitates informed decision-making.
As a Microsoft Gold Partner, we have a proven track record of delivering successful Microsoft-based solutions. Our deep understanding of Microsoft technologies like Power BI, Microsoft Fabric alongside our data analytics expertise positions us well to maximize the benefits for your business. Contact us today…